

Canada’s July Home Sales: What CREA’s Numbers Actually Show
A note on timing: CREA released this data on August 18. This piece was written a few days later than our usual news turnaround — worth saying upfront, because the useful read on a monthly housing report isn’t always the fastest one. Sales data doesn’t go stale in a week; the pattern across four straight months of releases is more informative than any single headline would have been.
National home sales climbed for a fourth straight month in July, according to the Canadian Real Estate Association — but “climbed” is doing a lot of quiet work in that sentence. Sales rose just 0.5% from June, prices are still down year over year in most of the country, and the most interesting number in the whole release isn’t the one CREA led with.
The Headline Numbers, Straight
Nationally, home sales edged up 0.5% month over month in July, while new listings fell 1.6% over the same period — fewer sellers showing up, slightly more buyers closing. The national Composite MLS Home Price Index ticked up just 0.1% from June. Year over year, the picture is softer: actual (non-seasonally adjusted) sales sit 5.3% below July of last year, and the benchmark price index is down 3.3% year over year, even though the national average price of $674,819 is technically up 0.2% versus a year ago — a gap that’s mostly about which properties sold, not a genuine price recovery (Storeys’ full breakdown of the July release has the complete national and regional table).
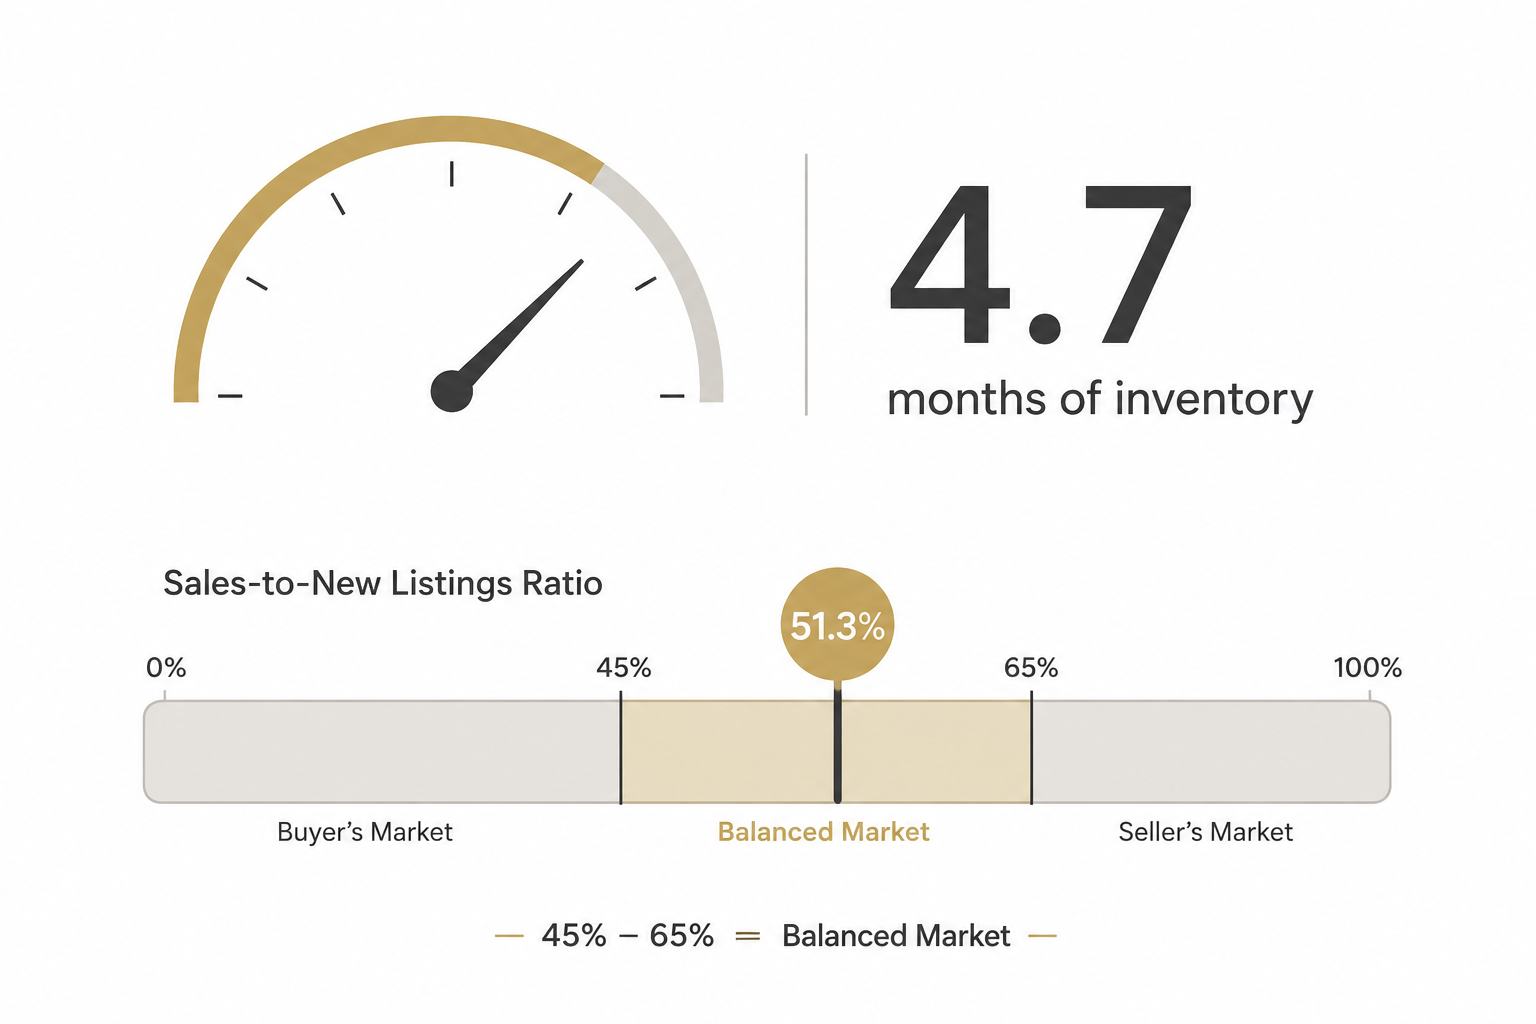
Those two numbers matter more than the headline sales figure, because they describe the actual balance of power in the market right now, not just one month’s transaction count. A sales-to-new-listings ratio in the 45%–65% range is what CREA and most economists consider “balanced” — neither buyers nor sellers holding meaningfully more leverage. July’s 51.3% sits comfortably inside that band, and 4.7 months of inventory being the tightest reading all year tells you listings have been shrinking faster than sales have been growing. That’s a market quietly firming up, not one that’s suddenly hot.
“A Carbon Copy of June” — CREA’s Own Read
“July’s housing data was a carbon copy of the June numbers, with home sales edging up a little further, listings down, and prices remaining stable.”
That’s CREA Senior Economist Shaun Cathcart’s assessment, and it’s a more useful summary than any single headline figure — the story in July isn’t a dramatic shift, it’s a fourth consecutive month of the same slow, unglamorous stabilization. CREA Chair Garry Bhaura’s read points the same direction: “more moderate housing market conditions can be expected to continue” (Zoocasa’s regional analysis of the July data has both quotes in fuller context, alongside a market-by-market price table). Four straight months of the same quiet direction is arguably the actual headline — a single hot or cold month gets forgotten fast, but a consistent four-month trend is what tends to show up in mortgage pricing and buyer psychology alike.
Underneath the National Number: A Very Uneven Map
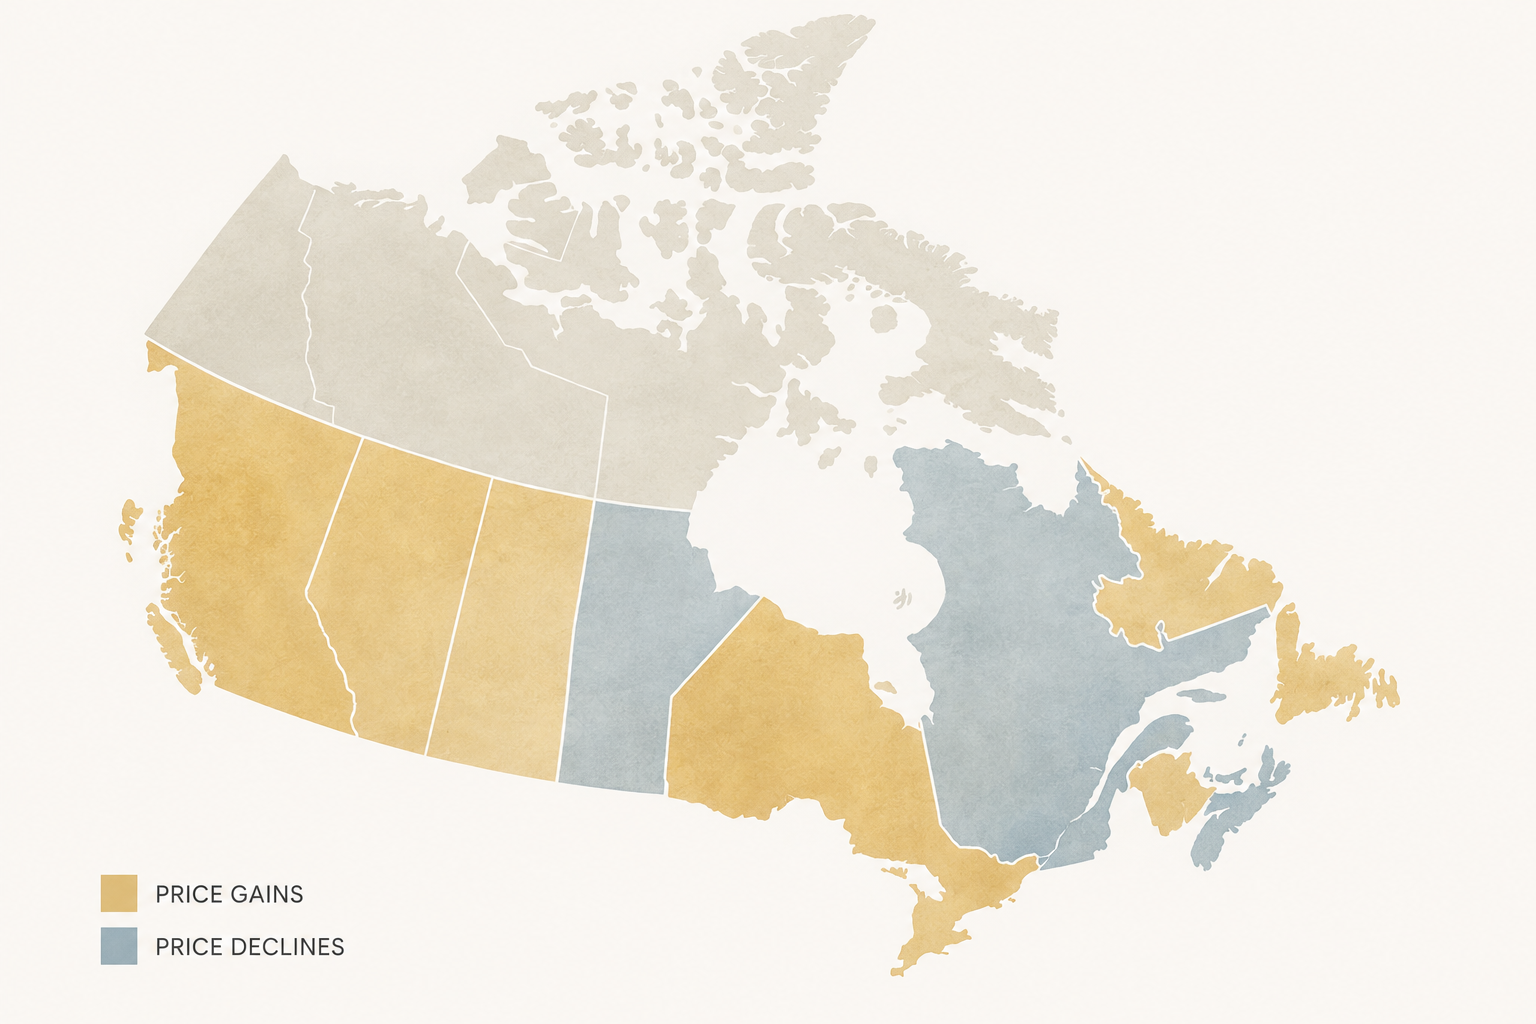
The national figures flatten a market that looks nothing alike from region to region. Sixty-two percent of tracked regions — 37 of 59 — actually saw prices fall month over month in July, even while the national average ticked up; Mississauga led the declines at 3%, and Simcoe & District wasn’t far behind at 2.4%. Meanwhile Quebec CMA posted the largest monthly gain among the 21 regions that rose, at 0.4%. Year over year the spread is even wider: Regina is up 13%, Sherbrooke CMA up 11.1%, while London–St. Thomas is down 7.2% and Windsor-Essex down 7%. If you’re reading this because you’re watching a specific market rather than the national average, the national number is close to useless to you — the regional table is where the real signal is.
Where This Leaves Ontario
Ontario’s Greater Golden Horseshoe moved from clearly buyer’s-market conditions earlier in 2026 to near-average inventory levels by July — a meaningful shift, and one that lines up with what we flagged in the GTA market earlier this year as the region’s leverage started shifting back toward sellers. Greater Toronto’s new listings were down 17.8% year over year, which is the mechanical reason inventory tightened even without a sales surge — fewer new properties hitting the market, not a wave of new buyers. That inventory story is the same one behind the Bank of Canada’s June rate hold and what it meant for Ontario housing — rates staying flat gave sellers less reason to panic-list, and that’s shown up directly in July’s numbers.
What This Means If You’re Actually Buying or Selling
If you’ve been waiting for a clearer signal before listing or making an offer, July’s data is about as clear as this market gets right now: balanced, tightening slowly, regionally scattered, and unmistakably not the sharp correction some 2026 forecasts predicted earlier in the year. That’s consistent with the more measured take we laid out in our piece on whether to wait to buy in Ontario — the “wait for a crash” strategy isn’t being rewarded by these numbers, and the “rush before it’s too late” strategy isn’t being rewarded either. It’s a market that’s rewarding patience over predictions, four months running.
Frequently Asked Questions
Are Canadian home prices actually falling in 2026?
It depends which number you use. The national average price is up 0.2% year over year, but that figure is skewed by which types of properties sold. The MLS Home Price Index — a better like-for-like measure — is down 3.3% year over year, and 62% of tracked regions saw month-over-month price declines in July.
What does “months of inventory” actually measure?
It’s how long it would take to sell every currently listed property at July’s sales pace. At 4.7 months nationally — the tightest reading of 2026 — Canada is inside balanced-market territory (roughly 4–6 months); a number well above that favours buyers, well below it favours sellers.
Why did Ontario’s market shift from buyer-friendly to balanced?
Mainly a listings story, not a demand surge: new listings in Greater Toronto fell 17.8% year over year, tightening inventory even without a sharp jump in sales. The Bank of Canada’s June rate hold likely reduced pressure on sellers to list quickly, compounding the effect.
Is this the start of a housing market recovery?
CREA’s own economists describe it as moderation, not recovery — four consecutive months of small, steady movement rather than a sharp reversal in either direction. Regional performance remains highly uneven, with some markets (Regina, Sherbrooke) posting double-digit annual gains while others (London–St. Thomas, Windsor-Essex) are still declining.
Four months of “more of the same” isn’t a headline that writes itself, which is probably why it took a few extra days to get to. But a market that’s quietly stabilizing, region by uneven region, is the more useful thing to understand than whatever the next single-month surprise turns out to be.
Four quiet months in a row is a trend. One loud month never is.
— NestDigest